Park Live Dashboard for Operators#
The Park Live Dashboard is a web interface for SIMPaCT’s digital twin users to access relevant information in a user-friendly manner. The dashboard has a public and a private version. The public version is available to all users. The private version is available to park operators and presents a dashboard of relevant data to park operators, enabling them to optimise irrigation schedules to provide urban cooling, as well as diagnose potential problems within the park. The dashboard’s user-friendly interface makes it easy for operators to access and analyze data, enabling quick decision-making and efficient park management.
To access the dashboard you need to be logged in. You find the login button in the top right corner of the page. If you do not have an account yet, please get in touch with us.
Overview#
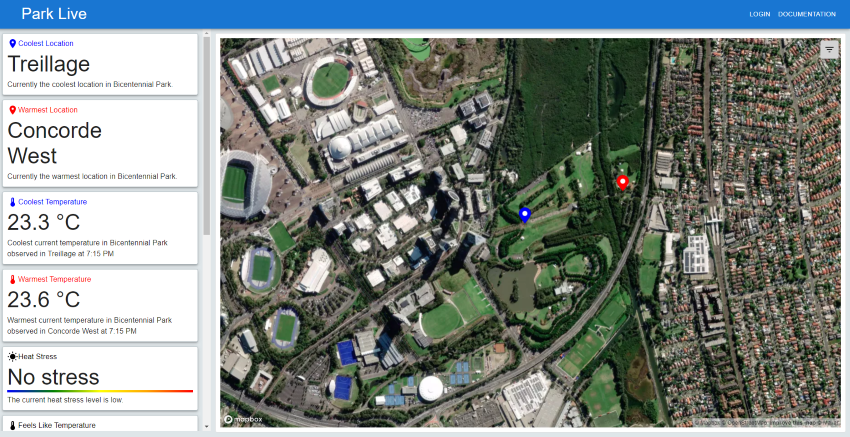
The dashboard is divided into two sections: the left side shows the tiles and the right side shows the map. The tiles present high-level information about the park. The map shows the park in detail and allows you to access more information about the park.
Tiles#
A detailed description of the tiles can be found here.
Map and detailed information#
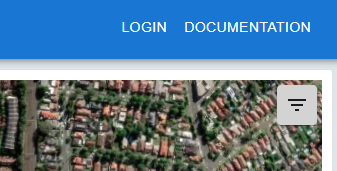
To access the data visualisations and detailed information about the park, click on the hamburger menu in the top right corner of the map.
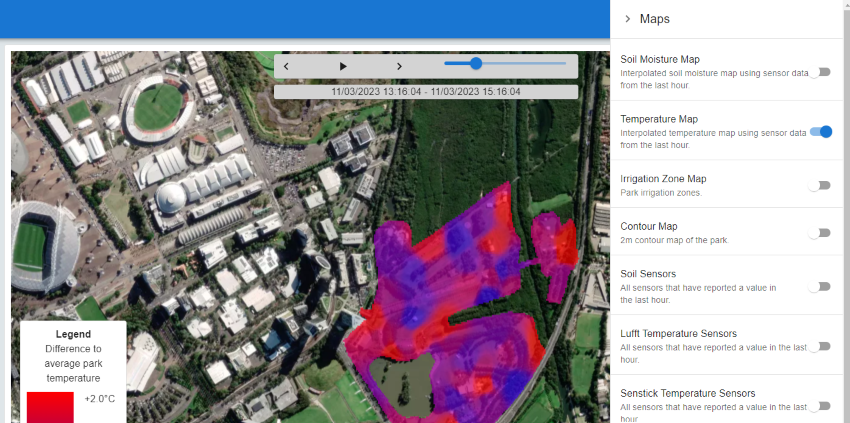
This will open the menu on the right side of the screen. Toggling an item in the menu will show the corresponding data visualisation on the map or open a pop-up with detailed information about the park. For example in the image below, the “Temperature Map” is selected. This will show the temperature map.
Following is a list of the available data visualisations and detailed information:
Temperature Map#
The temperature map shows the interpolated temperature values for the last 3 days. For the interpolation the Senstick sensor data are used. Since the temperature sensors are not evenly distributed, the temperature values are interpolated to fill the gaps. For the interpolation, the inverse weighted distance method is used. The exact location of the sensors and readings are shown in the Senstick Sensors map which can be used as an overlay.
Soil Moisture Map#
The soil moisture map shows the interpolated soil moisture values for the last 3 days. Since the soil moisture sensors are not evenly distributed, the soil moisture values are interpolated to fill the gaps. For the interpolation, the inverse weighted distance method is used. The exact location of the sensors and readings are shown in the Soil Sensors map which can be used as an overlay.
Note that the absolute values might not be comparable between different sensors, therefore the map should be used with caution.
Irrigation Zone Map#
This map outlines the irrigation zones and labels used for the zone in SIMPaCT. This map can be used as an overlay for any other map.
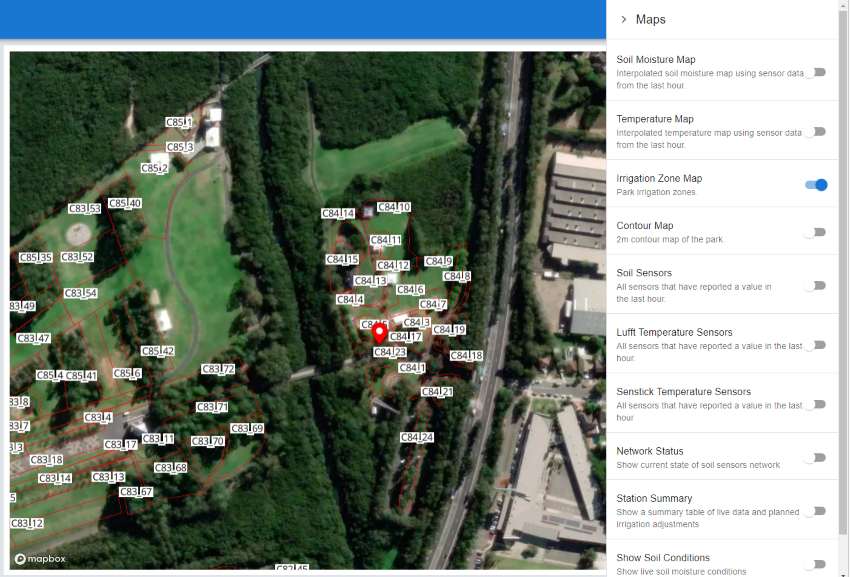
Clicking on a zone will bring up the zone’s information in the pop-up.
Soil Sensors#
The soil sensors map shows the location, sensor ID, and last recorded soil moisture value for each sensor. Note that this is the location recorded in SENAPS.
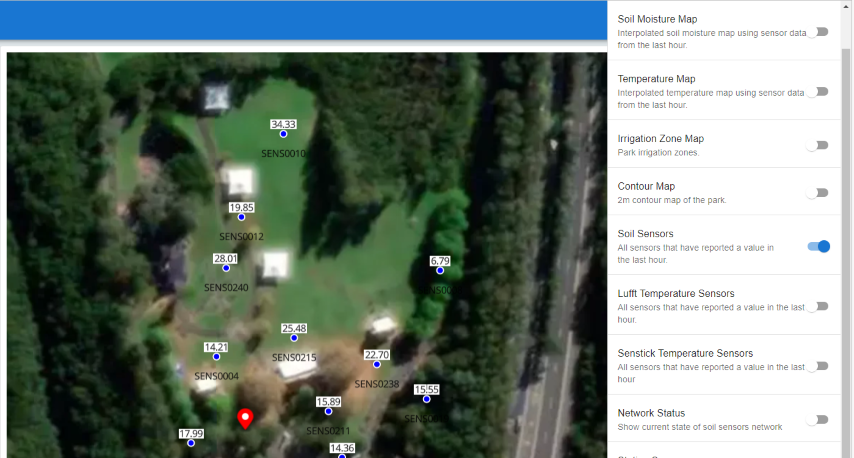
The sensor map can be used as an overlay with any other map. For example, using it in conjunction with the Soil Moisture Map will allow you to explore the soil moisture values over the last 3 days.
Lufft and Senstick Temperature Sensors#
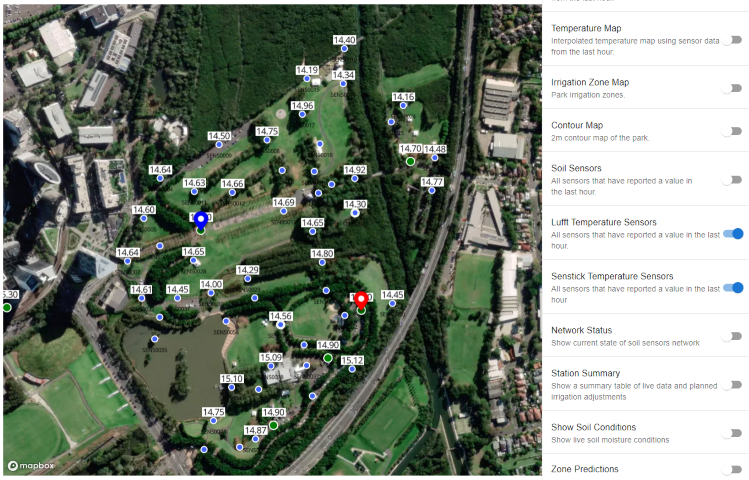
The Lufft and Senstick temperature sensors maps show the location, sensor ID, and last recorded temperature value for each sensor. Note that this is the location recorded in SENAPS. This map can be used as an overlay with the temperature map to explore the temperature values over the last 3 days.
Network Status#
The network status is shown as a pop-up. It shows the current status of the network and can be useful to diagnose potential problems.
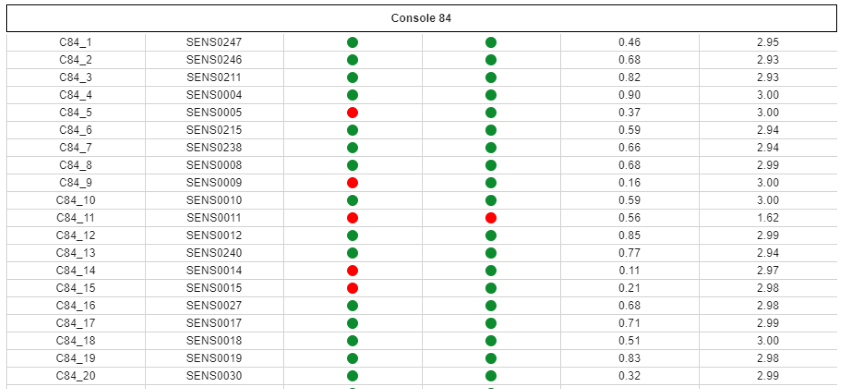
The following data is shown:
Green List. This indicates if the sensor has been Greenlisted by the project team to be used for forecasting. If the sensor is not green-listed, it will not be used for forecasting. The green list is updated regularly by the project team.
Reported in 24h. This shows if a sensor has reported data in the last 24 hours. If the sensor has not reported data in the last 24 hours, a red warning will be shown. It is important to note that the sensor might still be working, but the data might not have been received by the server. If the sensor has not reported data in the last 24 hours data from the previous day will be used for forecasting.
Reported in last 2 weeks. This shows if a sensor has reported data in the last 2 weeks. If the sensor has not reported data in the last 2 weeks, a red warning will be shown. The battery might be empty or the sensor might be broken. If the sensor has not reported data in the last 2 weeks the fallback model will be used for forecasting.
Calibration Quality. This shows the quality of the calibration of the sensor. For calibration quality, the Nash Sutcliffe Efficiency (NSE) is used. The NSE is a measure of how well the model fits the data. The NSE ranges from -∞ to 1, where 1 is the best possible fit. A value above 0.7 is considered very good (green) and a value above 0.5 is considered acceptable (amber).
Below 0.5 (red) is considered as bad and the sensor will not be used for forecasting. To troubleshoot the calibration please refer to the Troubleshooting Guide.
Battery Voltage. This shows the battery voltage of the sensor. Low battery voltage might indicate issues with recorded data. Also, the battery might need to be replaced soon.
Station Summary#
The station summary shows a summary of key data informing the proposed irrigation schedule for the next 3 days. The information in the table is updated every morning at 10 am.
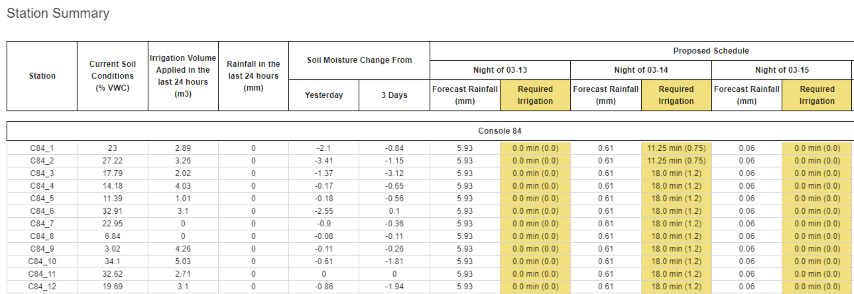
The following data is shown:
Irrigation Volume and Rainfall in the last 24h
Soil moisture change in the last 24h and last 3 days. This information can be useful to adjust the irrigation schedule or identify potential problems with the irrigation system.
Proposed Schedule. This shows the proposed irrigation schedule for the next 3 days for each station.
Station Overview#
The station overview can be assessed either by clicking on a station in the Station Summary or by clicking on a station in the map. The station overview shows detailed information about the station.
This is where you can modify the station’s parameters used by SIMPaCT.
The following data is shown:
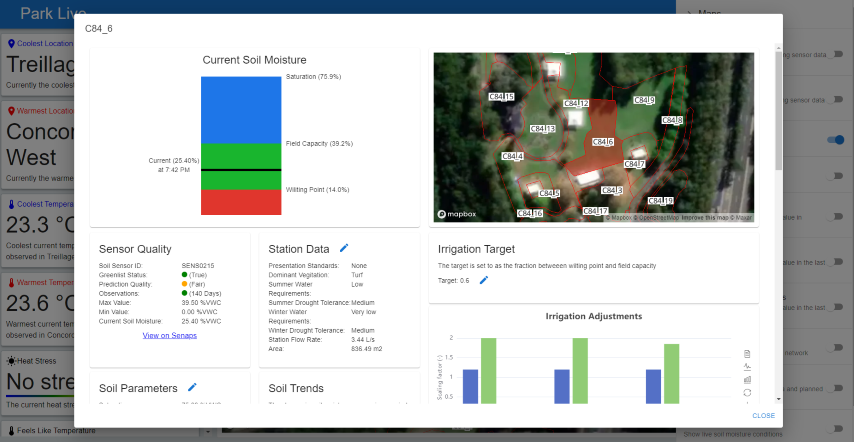
Current Soil Moisture shows the estimated values for saturation, field capacity, and wilting point derived from the calibrated bio-physical model. It also shows the current soil moisture value.
Sensor Quality shows a summary of the sensor information used by the stations.
Station Data shows a summary of the data used to inform the irrigation
Irrigation Target shows the current target of irrigation between wetting up and field capacity.
Soil Parameters presents a detailed overview of the soil parameters derived from the calibrated bio-physical model.
Soil Trends shows the soil moisture changes of the am soil moisture values over the last 12h, 24h, 3, and 7 days.
Irrigation Adjustments show the scaling factors used to adjust the irrigation schedule.
Soil Moisture and Irrigation History shows the following data for the last month.
soil moisture observations and forecast under different scenarios
irrigation history and forecast
soil moisture target
past observed rainfall and forecast rainfall
past evapotranspiration
observed temperature
Full Soil Moisture History shows the full soil moisture history and target, irrigation, and rainfall for the station.
Full Soil Moisture Exceedance Plot shows the fraction of time the soil moisture at a certain soil moisture value. This can be used to identify field capacity and wilting point.