Park Live Dashboard#
Overview#
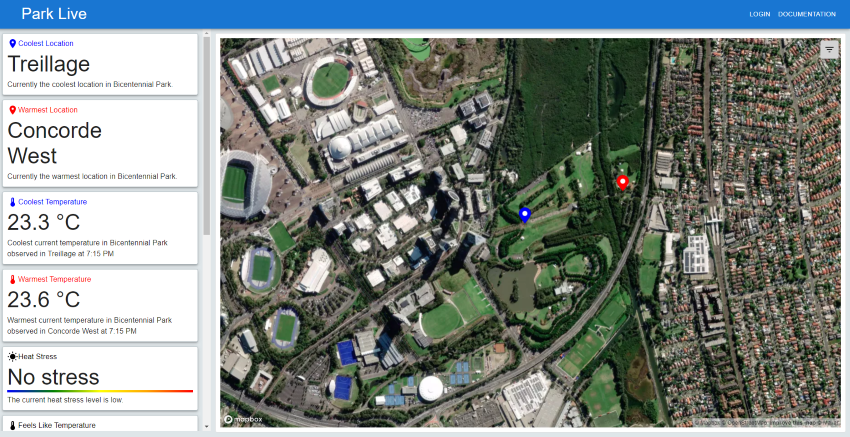
The dashboard is divided into two sections: the left side shows the tiles and the right side shows the map. The tiles present high-level information about the park. The map shows the park in detail and allows you to access more information about the park.
Tiles#
A detailed description of the tiles can be found here.
Map and detailed information#
To access the data visualisations and detailed information about the park, click on the hamburger menu in the top right corner of the map.
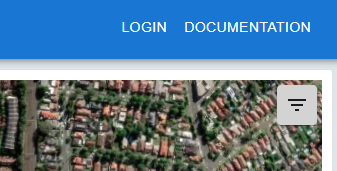
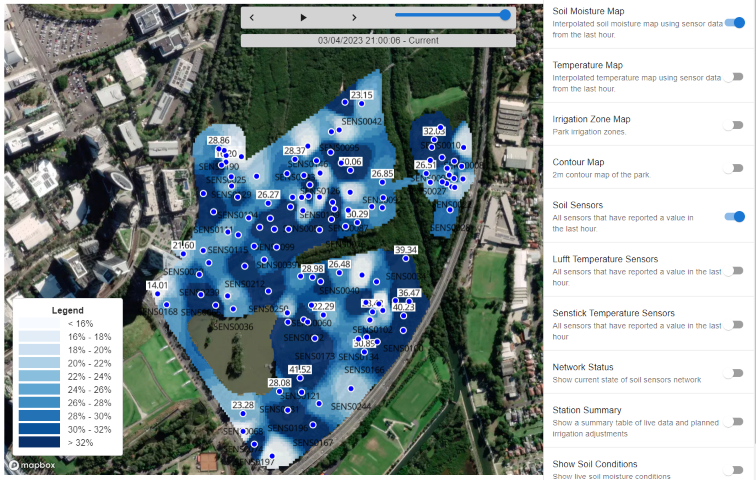
This will open the menu on the right side of the screen. Toggling an item in the menu will show the corresponding data visualisation on the map or open a pop-up with detailed information about the park. For example in the image below, the “Temperature Map” is selected. This will show the temperature map.
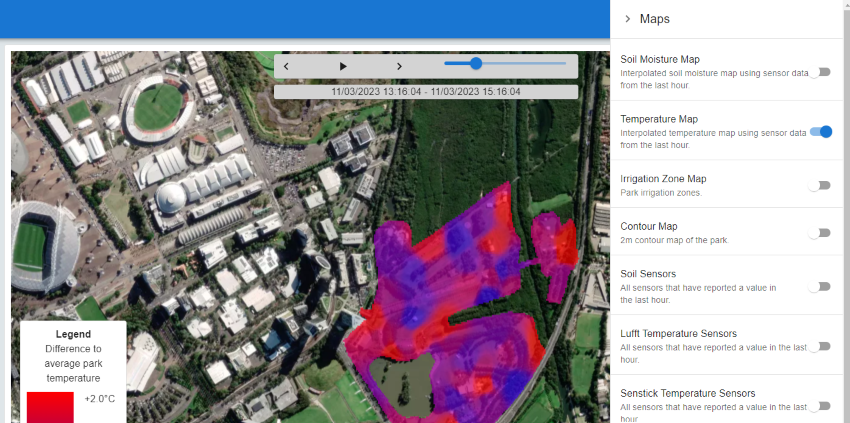
Following is a list of the available data visualisations and detailed information:
Soil Moisture Map#
The soil moisture map shows the interpolated soil moisture values for the last 3 days. Since the soil moisture sensors are not evenly distributed, the soil moisture values are interpolated to fill the gaps. For the interpolation, the inverse weighted distance method is used. The exact location of the sensors and readings are shown in the Soil Sensors map which can be used as an overlay. Note that the absolute values might not be comparable between different sensors, therefore the map should be used with caution.
Temperature Map#
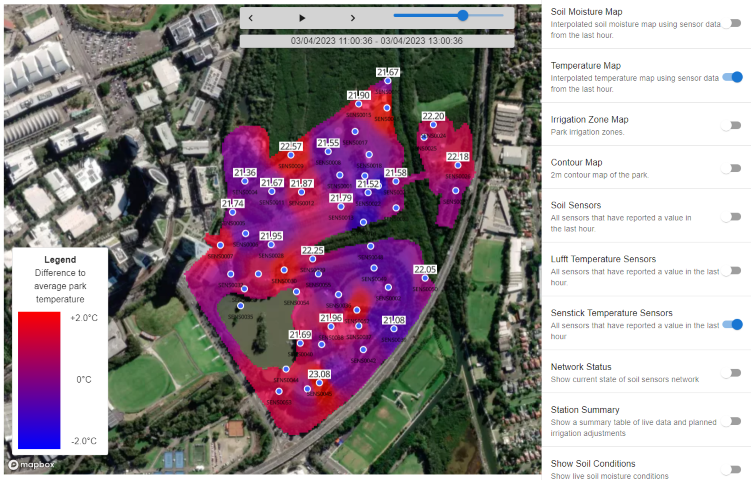
The temperature map shows the temperature difference across the park. The temperature difference is calculated as the average temperature across the marked area minus the temperature at a given location. The temperature at a given location is calculated using the inverse weighted distance method. The temperature map is updated every 30 minutes. Using the time slider, you can explore the temperature difference over the last 3 days. To add the temperature readings to the map, use the “Senstick Sensors” overlay.